Analytics
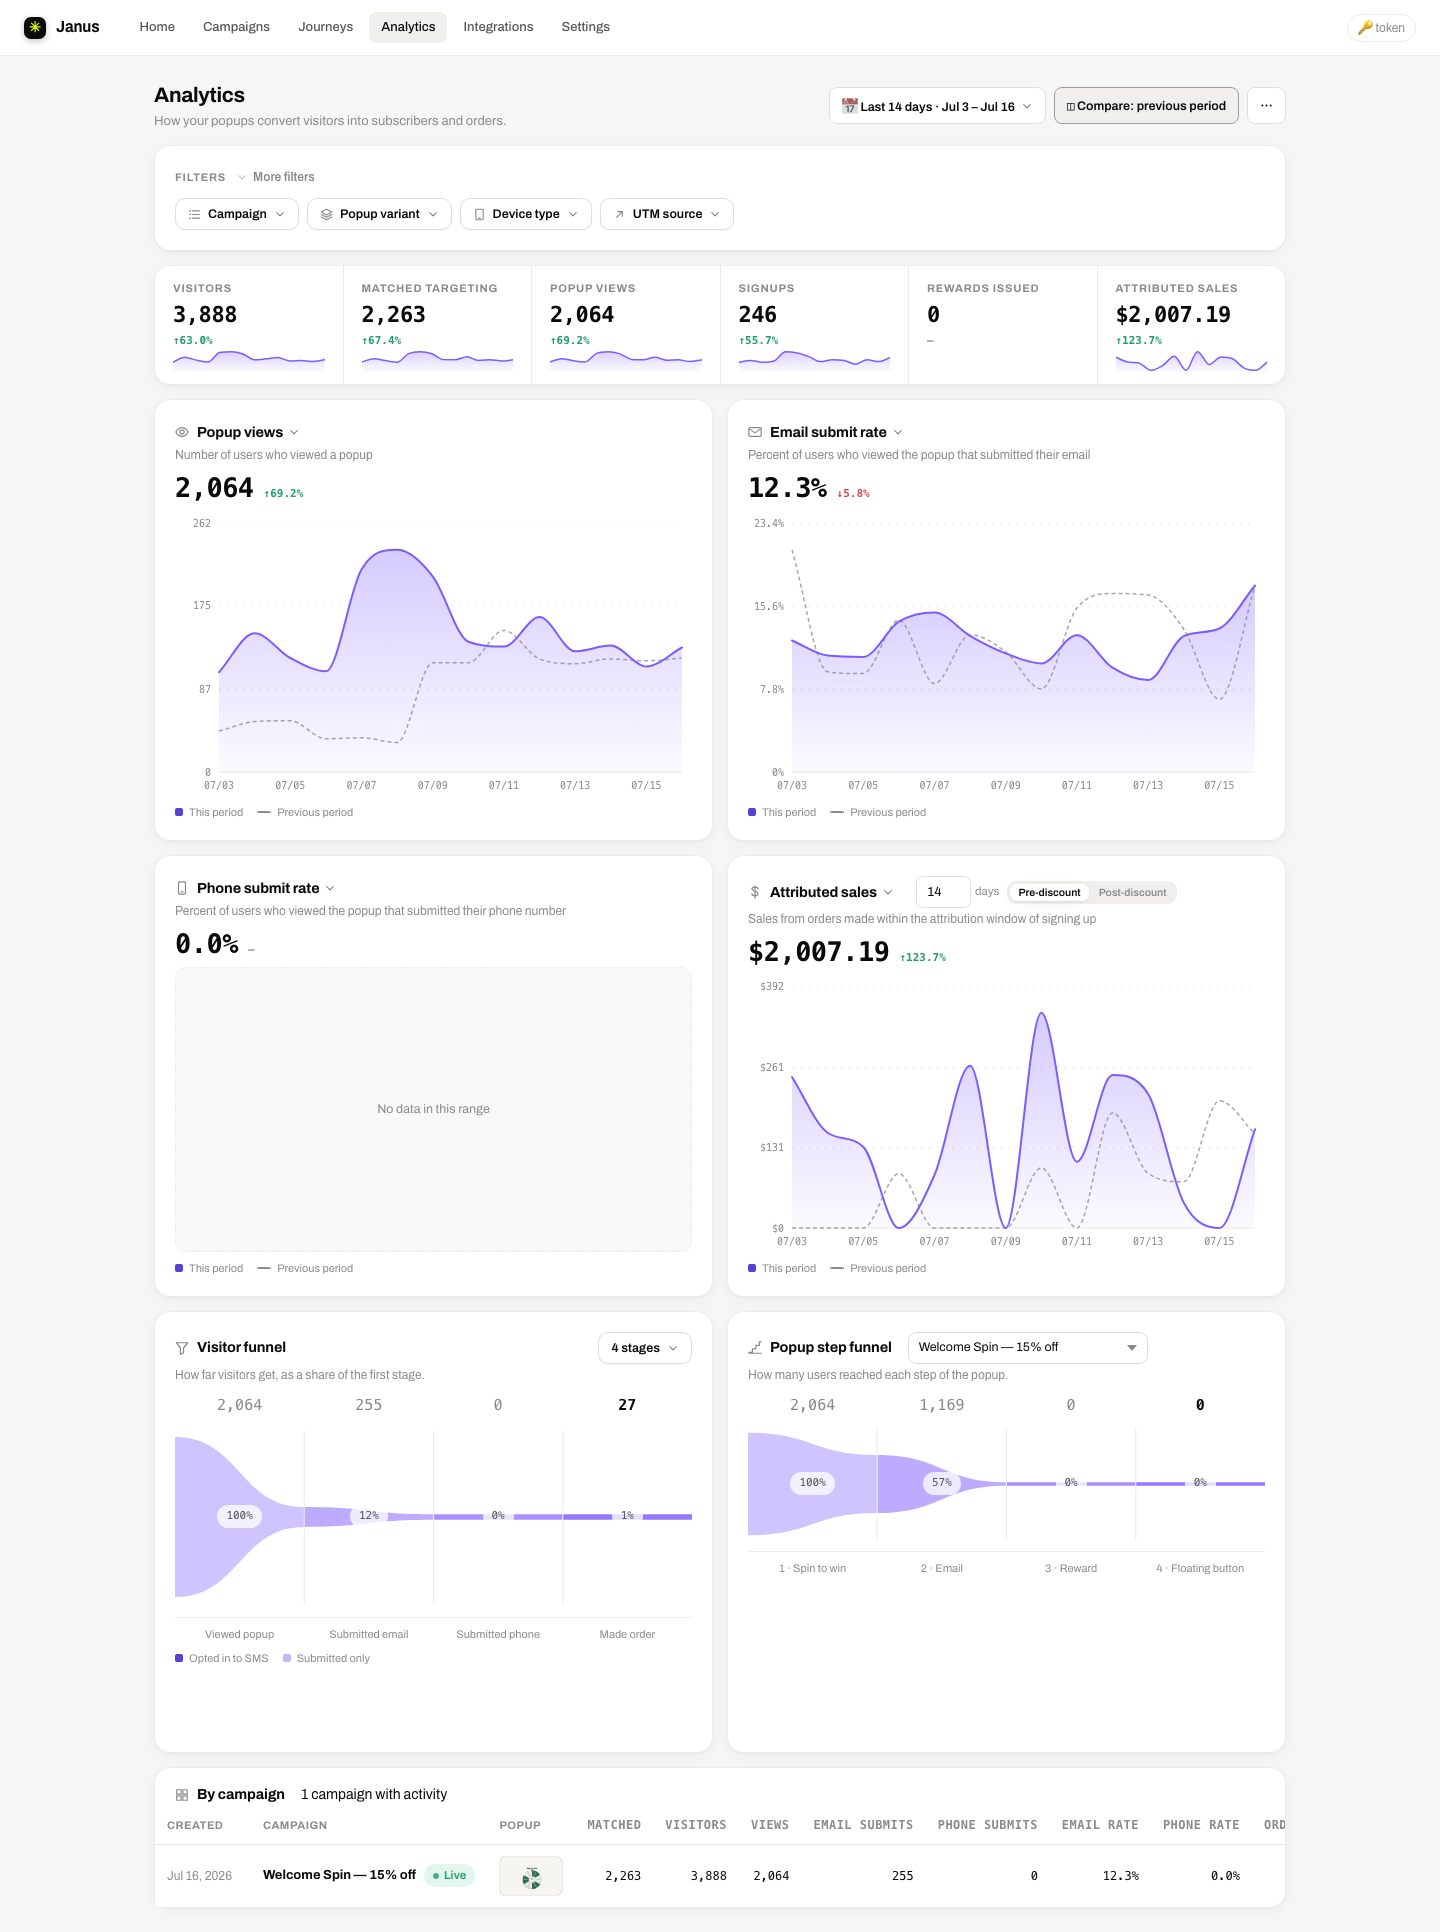
How your popups convert visitors into subscribers and orders, with honest definitions. Submissions and opt-ins are different numbers here, on purpose.
The metrics, defined
| Metric | Definition |
|---|---|
| Visitors | Unique sessions on your store where the widget ran. Bot traffic and your own previews never count. |
| Matched targeting | Visitors who satisfied a live campaign's audience rules. |
| Popup views | Popups actually opened. Popup view rate = views ÷ matched. |
| Email submissions | Email addresses entered. Email submit rate = submissions ÷ views. |
| Email opt-ins | Consented, net-new subscribers; resubmissions of already-known emails don't inflate this. The number your list actually grew by. |
| Phone submissions / SMS opt-ins | Same pair for phone capture, with SMS consent required. |
| Teaser views / clicks | The teaser button working: shown, and clicked back open. |
| Rewards issued | Codes minted or served. |
| Attributed sales / orders | Orders matched to a signup within the attribution window; see Attribution. |
| Purchase rate | Signups that made an order within the window. |
| Attributed AOV | Average value of attributed orders. |
| Time to purchase | Median signup→order time, with a distribution histogram. |
Ranges & comparisons
The date picker offers 7/14/30/90-day presets or a custom range. ◫ Compare overlays the previous period as dashed ghost lines and adds delta badges to every card. The four category cards (Popup views, Email, Phone & SMS, Attributed sales) each carry a metric-swap dropdown, and the sales card adds the attribution window and basis controls.
Filters & dimensions
The filter bar starts with Campaign, Popup variant, Device type and UTM source; More filters unfolds the rest:
- Popup properties: Reward, Survey answer (question, then value).
- What the user has done: has/has not submitted email or phone, viewed a popup, matched targeting, engaged with a step.
- Browsing: initial path, domain, UTM medium/campaign, browser, OS.
- Location & market: country, region, city, Shopify market, locale.
- Purchases: ordered product: segment everything by the people who went on to buy a specific item.
- Visitor state: fresh / engaged / subscribed / code-ready, as seen by the teaser button.
Every chip opens a distribution popover (you see each value's share before filtering) and supports Select or Exclude (shown as ¬ value). Filters stack, and every metric, chart and funnel on the page respects them. Answering "what's the opt-in rate for mobile Instagram traffic that answered gifting?" is three chips.
Saved segments
The Segment chip stores an audience you keep coming back to. Set up the filter bar the way you want it and pick + Save current filters as a segment; from then on that exact audience is one click, here and on A/B test results. Segments can also combine groups with OR logic (say, mobile visitors or paid Facebook traffic), something stacked filters alone can't express.
Custom reports
Below the dashboard lives Reports: your saved views of this data. + Create report opens a full-screen builder: add chart blocks (bar, pie, line, multi-line, funnel) and table blocks (any metrics as columns, any dimension as rows), each independently configured. Blocks follow the Analytics page's live filters and date range by default, or pin their own. Prefer to just ask? Describe the report ("email submit rate by UTM source, last 30 days") and Draft it proposes the blocks; nothing saves until you hit Save report.
Saved reports render inline with live mini-previews, start from ready-made templates (top UTM sources, revenue by product, reward performance, visitor funnel…), and ⤓ Export CSV downloads exactly the table you're looking at: same filters, same range, spreadsheet-safe.
Funnels
- Visitor funnel: Visitors → Matched targeting → Viewed popup → Submitted email → Submitted phone → Revealed reward → Made order, each as a share of the first stage, with a stage picker to widen or tighten the view.
- Popup step funnel: inside one campaign: how many visitors reached each step of the flow, split per variant when a test is running. The fastest way to find the step where people bail.
Busiest times
An hour-by-weekday heatmap answers when visitors engage; switch it between Popup views, Visitors, Email submissions and Phone submissions. Useful for timing a launch popup or a dayparted campaign to when your traffic actually shows up.
By campaign
The bottom table lines up every campaign: thumbnail, matched, visitors, views, email/phone submits and rates, orders, sales, AOV, purchase rate. Click a row to filter the whole page to that campaign; that also unlocks the survey answers breakdown (your zero-party data as bars) and the ⋯ menu's ✦ AI summary, a narrative read of the filtered numbers.
Bounce & sitewide impact
The Popup views card can swap to Bounce rate: the share of sessions that left after a single page, the honest check that a popup isn't chasing shoppers away. A/B test results show each arm's site conversion and site sales alongside the popup metrics, so a variant that wins the sign-up race but hurts the store shows its cost.
Freshness
Events stream in live. Order attribution refreshes continuously; ⋯ → ↻ Refresh attribution forces a re-match on demand and reports how many new orders were claimed.